Sound is a wave phenomenon like light, but is macroscopic and involves molecules of air being compressed and expanded under the action of some physical device.
For example, a speaker in an audio system vibrates back and forth and produces a longitudinal pressure wave that we perceive as sound.
Since sound is a pressure wave, it takes on continuous values, as opposed to digitized ones.
Even though such pressure waves are longitudinal, they still have ordinary wave properties and behaviors, such as reflection (bouncing), refraction (change of angle when entering a medium with a different density) and diffraction (bending around an obstacle).
If we wish to use a digital version of sound waves we must form digitized representations of audio information.
Digitization means conversion to a stream of numbers, and preferably these numbers should be integers for efficiency.
Fig. 1 shows the 1-dimensional nature of sound: amplitude values depend on a variable, time.
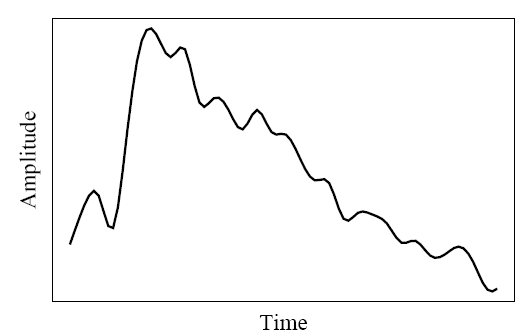
Fig 1. An analog signal: continuous measurement of pressure wave.
The graph in Fig.1 has to be made digital in both time and amplitude. To digitize, the signal must be sampled in each dimension: in time, and in amplitude.
Sampling means measuring the quantity we are interested in, usually at evenly-spaced intervals.
The first kind of sampling, using measurements only at evenly spaced time intervals, is simply called, sampling. The rate at which it is performed is called the sampling frequency (see Fig. 2(a)).
For audio, typical sampling rates are from 8 kHz (8,000 samples per second) to 48 kHz. This range is determined by Nyquist theorem discussed later.
Sampling in the amplitude or voltage dimension is called quantization. Fig. 2(b) shows this kind of sampling.
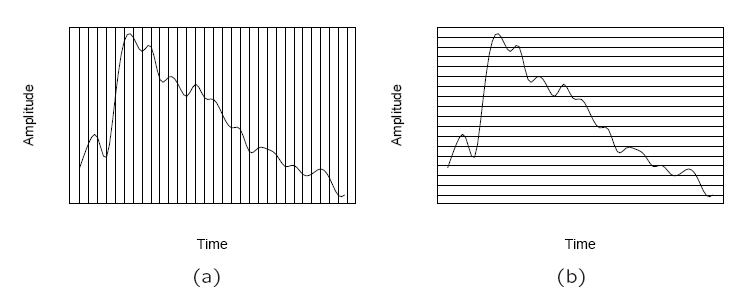
Fig. 2: Sampling and Quantization. (a): Sampling the analog signal in the time dimension. (b): Quantization is sampling the analog signal in the amplitude dimension.
Thus to decide how to digitize audio data we need to answer the following questions:
What is the sampling rate?
How finely is the data to be quantized, and is quantization uniform?
How is audio data formatted? (file format)
Signals can be decomposed into a sum of sinusoids. Fig. 3 shows how weighted sinusoids can build up quite a complex signal.
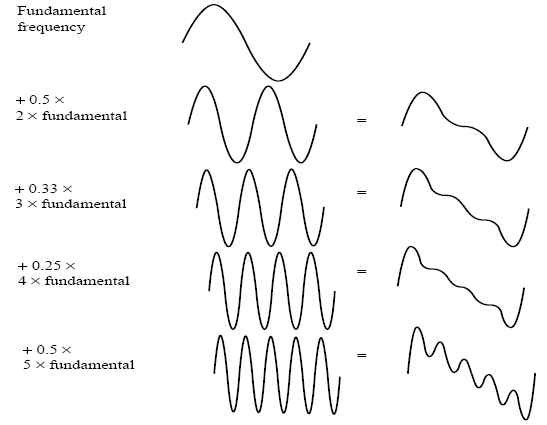
Fig. 3: Building up a complex signal by superposing sinusoids
The Nyquist theorem states how frequently we must sample in time to be able to recover the original sound.
Fig. 4(a) shows a single sinusoid: it is a single, pure, frequency (only electronic instruments can create such sounds).
If sampling rate just equals the actual frequency, Fig. 4(b) shows that a false signal is detected: it is simply a constant, with zero frequency.
Now if sample at 1.5 times the actual frequency, Fig. 4(c) shows that we obtain an incorrect (alias) frequency that is lower than the correct one — it is half the correct one (the wavelength, from peak to peak, is double that of the actual signal). Thus for correct sampling we must use a sampling rate equal to at least twice the maximum frequency content in the signal. This rate is called the Nyquist rate.
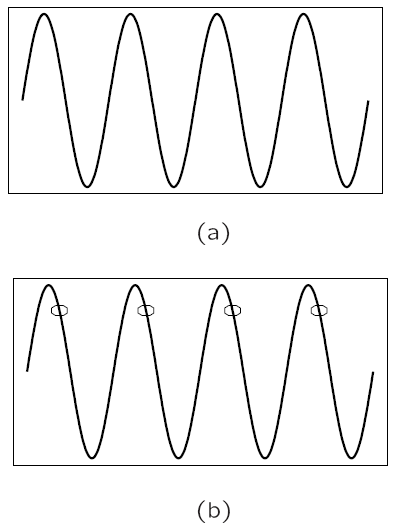
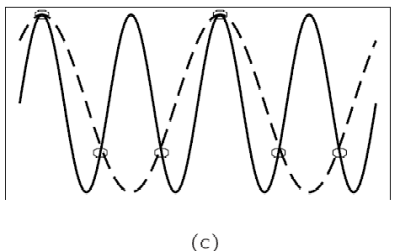
Fig. 4: Aliasing. (a): A single frequency. (b): Sampling at exactly the frequency produces a constant. (c): Sampling at 1.5 times per cycle produces an alias perceived frequency.
Nyquist Theorem: If a signal is band-limited, i.e., there is a lower limit f1 and an upper limit f2 of frequency com-ponents in the signal, then the sampling rate should be at least 2(f2 − f1).
Nyquist frequency: half of the Nyquist rate.
Since it would be impossible to recover frequencies higher than Nyquist frequency in any event, most systems have an antialiasing filter that restricts the frequency content in the input to the sampler to a range at or below Nyquist frequency.
The relationship among the Sampling Frequency, True Fre-quency, and the Alias Frequency is as follows:
falias = fsampling − ftrue, for ftrue <fsampling < 2 × ftrue (6.1)
In general, the apparent frequency of a sinusoid is the lowest frequency of a sinusoid that has exactly the same samples as the input sinusoid. Fig. 5 shows the relationship of the apparent frequency to the input frequency.
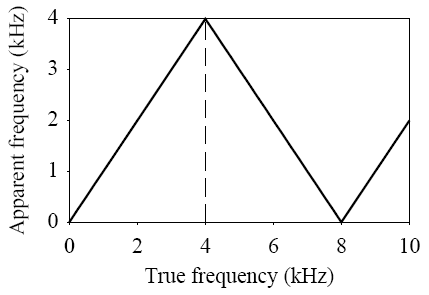
Fig. 5: Folding of sinusoid frequency which is sampled at 8,000 Hz. The folding frequency, shown dashed, is 4,000 Hz.
The ratio of the power of the correct signal and the noise is called the signal to noise ratio (SNR) — a measure of the quality of the signal.
The SNR is usually measured in decibels (dB)l. The SNR value, in units of dB, is defined in terms of base-10 logarithms of squared voltages, as follows:
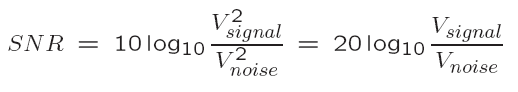
a) The power in a signal is proportional to the square of the voltage. For example, if the signal voltage Vsignal is 10 times the noise, then the SNR is 20 ∗ log10(10)=20dB.
b) In terms of power, if the power from ten violins is ten times that from one violin playing, then the ratio of power is 10dB, or 1B.
Aside from any noise that may have been present in the original analog signal, there is also an additional error that results from quantization.
If voltages are actually in 0 to 1 but we have only 8 bits in which to store values, then effectively we force all continuous values of voltage into only 256 different values. This introduces a roundoff error. It is not really “noise”. Nevertheless it is called quantization noise (or quantiza-tion error).
The quality of the quantization is characterized by the Signal to Quantization Noise Ratio (SQNR).
Quantization noise: the difference between the actual value of the analog signal, for the particular sampling time, and the nearest quantization interval value. At most, this error can be as much as half of the interval.
For a quantization accuracy of N bits per sample, the SQNR can be simply expressed:
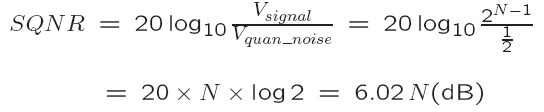 (6.3)
(6.3)
(a) We map the maximum signal to 2N−1− 1( 2N−1)and the most negative signal to −2N−1.
(b) Eq. (6.3) is the Peak signal-to-noise ratio, PSQNR: peak signal and peak noise.
(c) The dynamic range is the ratio of maximum to minimum absolute values of the signal: Vmax/Vmin. The max abs. value Vmax gets mapped to 2N−1 − 1; the min abs. value Vmin gets mapped to 1. Vmin is the smallest positive voltage that is not masked by noise. The most negative signal, −Vmax,ismapped to −2N−1.
(d) The quantization interval is ΔV =(2Vmax)/2N , since there are 2N intervals. The whole range Vmax down to (Vmax − ΔV/2) is mapped to 2N−1− 1.
(e) The maximum noise, in terms of actual voltages, is half the quantization interval: ΔV/2=Vmax/2N .
Prior to sampling and AD conversion, the audio signal is also usually filtered to remove unwanted frequencies. The frequencies kept depend on the application:
(a) For speech, typically from 50Hz to 10kHz is retained, and other fre-quencies are blocked by the use of a band-pass filter that screens out lower and higher frequencies.
(b) An audio music signal will typically contain from about 20Hz up to 20kHz.
(c) At the DA converter end, high frequencies may reappear in the out-put — because of sampling and then quantization, smooth input signal is replaced by a series of step functions containing all possible frequencies.
(d) So at the decoder side, a lowpass filter is used after the DA circuit.
The uncompressed data rate increases as more bits are used for quantization. Stereo: double the bandwidth. to transmit a digital audio signal.
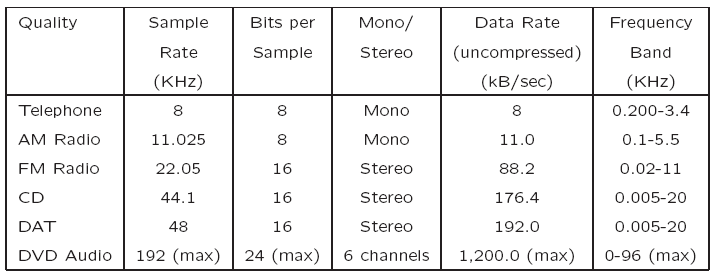
Data rate and bandwidth in sample audio applications
|
Copyright (c) 2013 AudioDope team. All rights reserved.
|
|
What do you think about this topic? Send feedback!
|


